The SCARE Risk Assessment Model
The model defines an extended risk assessment that includes the following categories:
CVE dynamics
SBOM
Software quality
Contributor profile
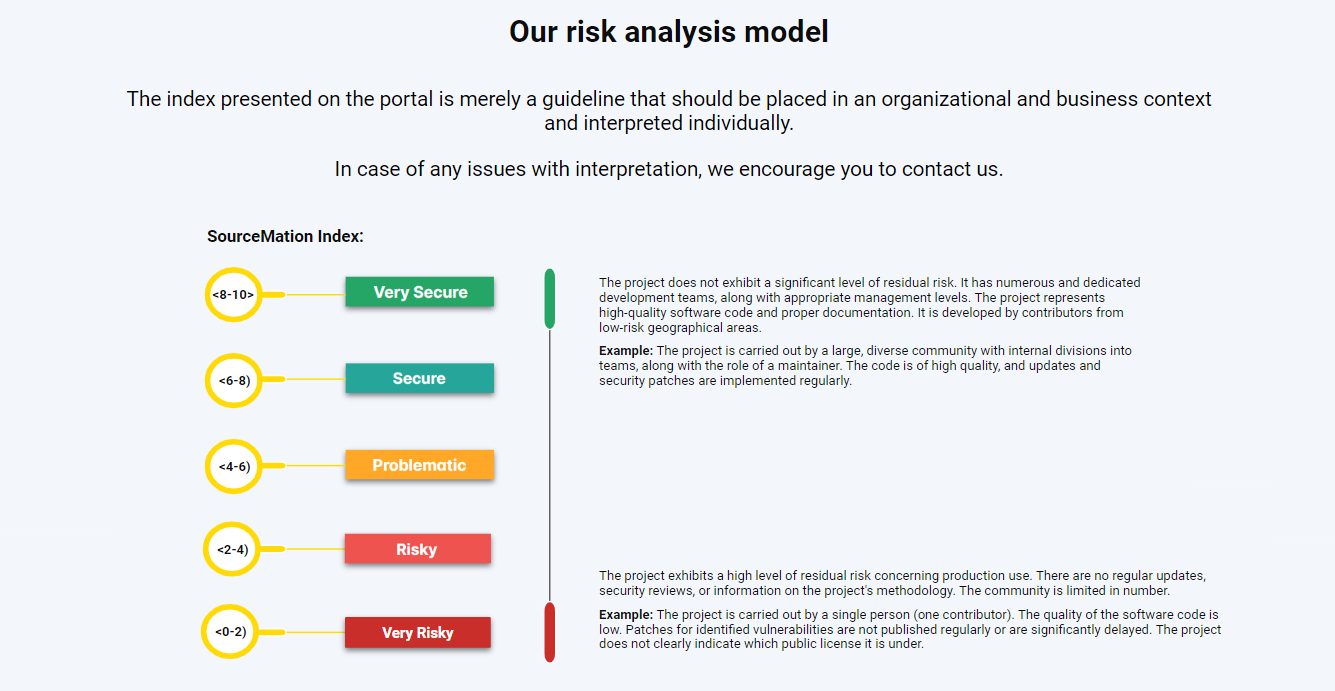
SCARE
Historical perspective of assessment changes
Project dynamics
Level of technical debt
Legal aspects
SCARE Mathematical Model
The project aims to expand the capabilities of security assessment tools during the software composition analysis process. The SCARE acronym stands for Software Component Analysis for Risk Engineering.
Mathematical Model for Security Assessment
The mathematical model is based on a cascading (hierarchical) calculation of the weighted average for a set of risk factors that affect the analyzed component. These factors include the project contributor profile, CVSS score, and project language profile rating. The term “component” is a general designation for any entity that groups or constitutes an independent IT artifact, such as a binary, software package, operating system, or a Helm chart.
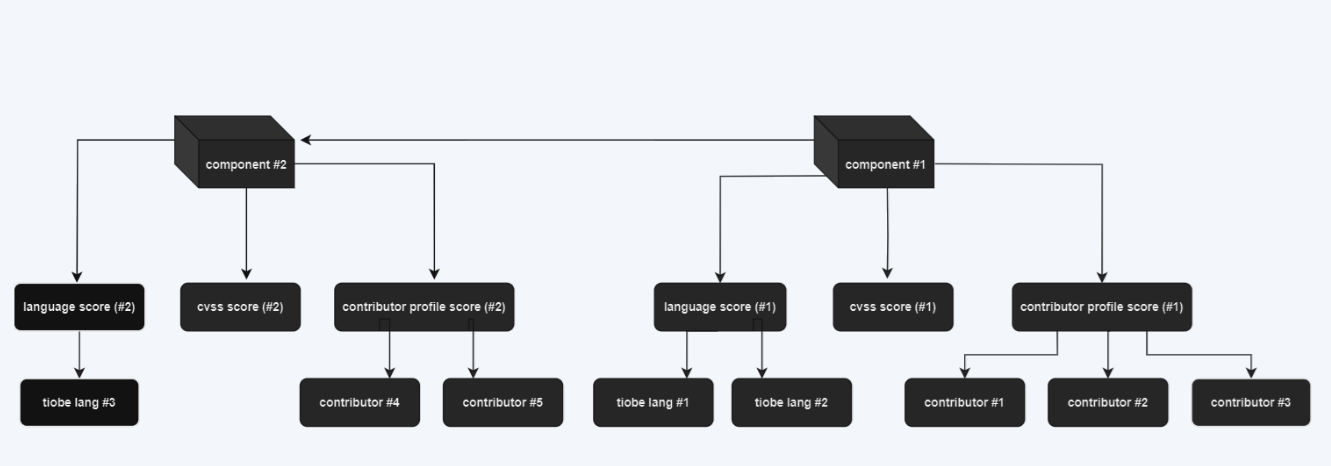
According to the diagram, the following interpretation applies:
- Rectangles correspond to the project assessment, determined by averaging the scores of their respective risk factor categories, e.g., “cvss score (component #1)”.
- Ovals correspond to the assessment of individual factors, which in particular cases are also determined based on the weighted average of dependent factors, e.g., assessments of individual contributors.
- The final risk assessment of a given component (e.g., “component #1”) considers all dependent factors (e.g., CVSS, contributor profile) and the assessment of each of the dependent components (projects).
The Applied Mathematical Formula
To determine a score, data from various sources must be prepared using statistical methods such as data scaling. This method is used for both subject data and data used as weights in the scoring formula.
Scaling
Input data is scaled to a predetermined value range.
$$x \in R$$ $$\max{x} \neq \min{x}$$ $$x' = \frac{x - \min{x}}{\max{x} - \min{x}}$$However, due to the marginalization of the minimum value (which is significant from an analysis standpoint), causing a distortion in the distance between scaled values (by losing the reference point), the minimum value is set to 0. Therefore, the final formula takes the following form:
$$x \geq 0$$ $$\max{x} \neq 0$$ $$x' = \frac{x}{\max{x}}$$Alternatively, for features with positive values, uneven distribution, and a significant number of outliers, logarithmic scaling should be applied.
$$x' = \frac{\ln(x)}{\ln(\max{x})}$$It’s important to note that when using logarithmic scaling, a constant (e.g., 1) can be added to the value to exclude values smaller than 1. This will have an insignificant impact on the assessment, which is relative in nature.
$$x \in R$$ $$x \geq 0$$ $$\max{x} > 0$$ $$x' = \frac{\ln(x + 1)}{\ln(\max{x} + 1)}$$Average Weighted
Let the dataset be:
$$[x_1, x_2, \ldots, x_n]$$a set of data with non-negative weights, with at least one being non-zero, respectively:
$$[w_1, w_2, \ldots, w_n].$$The arithmetic weighted average is used.
$$\bar{x} = \frac{\sum_{i=1}^n w_i x_i}{\sum_{i=1}^n w_i},$$Therefore:
$$\bar{x} = \frac{w_1 x_1 + w_2 x_2 + \ldots + w_n x_n}{w_1 + w_2 + \ldots + w_n}.$$This way, data with higher weights have a greater contribution to the weighted average.
According to the above, for set 𝐴 representing the set of ordered pairs of ratings (𝑟) and weights (𝑤) of dependent components, and 𝐵 representing the set of ratings and weights of the subject component’s risk categories, and 𝜎 representing the statistical “enhancement” parameter, the assessment of the subject component is determined by the formula:
$$r, w, \sigma \in R$$ $$r, w \in \langle 0, 1 \rangle; \sigma \geqslant 1$$ $$A = \{(r_1, w_1), (r_2, w_2), \ldots, (r_n, w_n)\}$$ $$B = \{(r_1, w_1), (r_2, w_2), \ldots, (r_m, w_m)\}$$ $$\bar{s} = \frac{\sum_{i=1}^n a_{i_1} a_{i_2} + \sum_{j=1}^m \sigma b_{j_1} b_{j_2}}{\sum_{i=1}^n a_{i_2} + \sum_{j=1}^m \sigma b_{j_2}}$$Statistical enhancement allows for increasing the significance (impact) of the ratings of the subject component’s risk categories and balancing the influence of the ratings of dependent components. This formula is used in the same manner for each level of dependency.
Final Words
Like all models, the SCARE model has its limitations. It is important to remember that the model’s effectiveness depends on the quality and completeness of the input data. It can be challenging even with open-source software, where data may be incomplete, outdated or just not available. Additionally, the model may not account for all possible risk factors, especially those that are specific to certain industries or use cases.
It’s also worth noting that our SCARE model is not static. It is continuously updated and improved based on new data and feedback from users. Lastly the SCARE is complimentary tool to assist in risk assessment, and should not be the sole basis for making decisions about software security.